In recent months, there has been a conversation coming out of Washington D.C. about raising the minimum wage, not to mention all the comments from those in agreement and disagreement. While I’m not inclined to take a political position on the issue, I thought it a good opportunity to demonstrate the household economics of the minimum wage.
The U.S. Cost of Living Index (COLI) breaks up typical household expenditures into six main categories, as indicated below in a chart adapted from the most recent COLI released by The Council for Community and Economic Research (C2ER). (These categories and the COLI’s composite of values were discussed in more detail in a previous post.) In the tables and charts that follow, I utilize this percentage by category to demonstrate the budget of someone working 2,080 hours per year (40 hours per week) at the minimum wage (currently $7.25 per hour) and then use the same percentages to calculate a budget at the proposed increase of $9.00 per hour.
Typical Household Expenditures by Cost of Living Index Category
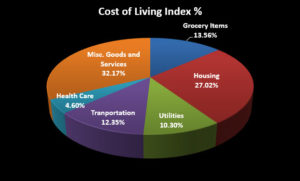
Chart adapted from The Council for Community and Economic Research Cost of Living Index.
Annual and Monthly Pre-Tax Budget for One Person Living on the Minimum Wage
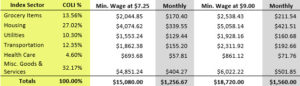
From the table above we can see that based on typical spending as extracted from the COLI, one person living at the minimum wage would have approximately $339.55 per month to spend on housing at the current minimum wage. If the proposed minimum wage increase to $9.00 per hour were to take effect, that would increase to $421.51 per month to spend on housing. While someone living on the minimum wage would very likely adjust the budget lines and cut back in certain areas, I use the COLI to demonstrate typicality.
In the table below, I present a household working at the minimum wage. I use the assumption that two persons in the household are working 40 hours per week at the minimum wage, even though some research indicates that it is not typical for all working persons in a household to be working at the minimum wage. In many locales, it is likely not economically feasible for two people working at the minimum wage to work only 40 hours per week, as demonstrated below.
Annual and Monthly Pre-Tax Budget for a Household Living on the Minimum Wage
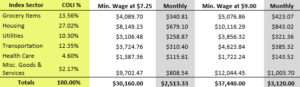
From the table above we can see that based on typical spending as extracted from the COLI, a household living at the minimum wage would have approximately $679.10 per month to spend on housing at the current minimum wage, and if the proposed minimum wage increase to $9.00 per hour were to take effect, that would increase to $843.02 per month to spend on housing.
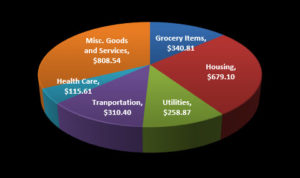
Pre-Tax Monthly Household Budget at $7.25/Hour
Pre-Tax Monthly Household Budget at $9.00/Hour
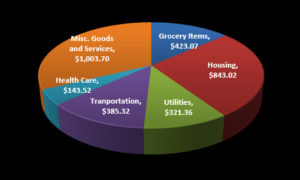
While the annual pre-tax household income would only jump by $7,280 per year, the household economic changes are notable. For instance, the housing budget would increase to $843.02 per month from $679.10, and there would be an extra $82.26 per month to spend on groceries.
The minimum wage is designed to be a minimum and not necessarily a living wage, but it is important to note that in 2012 approximately 4.7% of the American workforce earned exactly the minimum wage or below. That number translates into 3.6 million workers nationwide. Furthermore, the numbers here are pre-tax and could be significantly lower after taxes.
– Sarah J. Kilpatrick


Recent Comments