
At Greenfield Advisors, a large component of our background research is performed on similar cases in different areas of the country. For example, on a case involving contaminated properties, we would research other cases that had similar contamination; i.e., the type of contamination (e.g., petroleum products, metals, solvents), the media in which the contamination was found (e.g., soil, groundwater, air), and the amount of damages. Such case studies are a derivative of the sales comparison approach to valuation, but they are more in-depth and they examine how an event has affected price and value. Case studies rely on empirical information drawn from a variety of sources, and they provide a range of conclusions. Because there is seldom a perfectly comparable case study, we consider the characteristics of each study and its relevance to the current case.
Mapping case studies is something new that we are doing at Greenfield Advisors. We deal with complicated subjects that most people are not exposed to on a daily basis. By mapping case studies, we are trying to simplify the process and tell the story with a map or two rather than a 50-page report. Our reports try to paint a picture of the problem affecting the area that we are working in, and GIS is critical to that process because a map can convey the bigger issue easier than words.
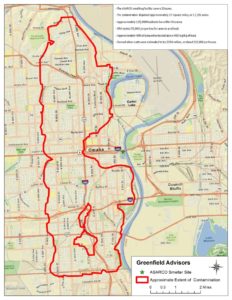
Our case study mapping demonstrates a synergy between visuals and text. We add the key points of each case study narrative to the maps. With each case study map, we show the size and location of the contaminated area visually, and then we provide a textbox listing the size in acres, the type of contamination, significant events in the history of the site, and finally the total costs of remediation. We try to cover just the main points so as not to bore our audience, but rather educate them regarding the process of finding and cleaning up contaminated areas. By mapping case studies, we are just trying to express complicated matters simply.
Because of our country’s industrial past, there is no shortage of potential case studies. Just look at the EPA’s Superfund work, or download their National Priorities List (NPL) or Toxics Release Inventory (TRI) shapefiles1 and you will see that this entire country is pretty polluted. So, we have a vast pool of cases to choose from. Case studies can be thought of as a history of pollution and other forms of property impairment. It is my job to map out that pollution and tell its story through imagery and a small narrative consisting of the main points. Below you will find an example of our case study mapping.
– Gabriel Bolden


Recent Comments