We are seeing more signs that the housing market is on the upswing. After the economic downturn, it was hard to find a news story on the real estate industry that didn’t mention homes underwater. Now, those stories are becoming less frequent with the news that just more than 10% of mortgaged homes are still in negative equity.
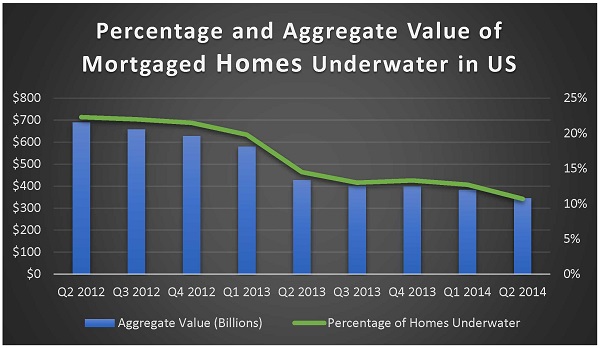
According to a recent report by CoreLogic, 10.7% of mortgaged homes were underwater in the second quarter of 2014. It’s a far cry from the 14.9% of mortgaged homes underwater during the same time last year. It’s a difference of a little more than 1.96 million homes that have returned to positive equity in the last 12 months.
Negative equity or being “underwater” means that more is owed on the mortgage than the home is worth. This is also sometimes referred to as being “upside down.” Homes worth more than is owed on the loan are considered to be in positive equity.

Data from CoreLogic.
Following the financial crisis, more than 12 million homes were in negative equity in fourth quarter 2009. The number of negative equity homes hovered above 11 million until early 2012, when the trend began to turn downward. Since 2013, fewer than 10 million homes have been in negative equity.
Now, only 5.3 million homes remain underwater. The aggregate value of the negative equity is $345.1 billion at the halfway mark of the year. In the last 12 months, negative equity has dropped about 20% from $432.9 billion. Unfortunately, equity is concentrated at the upper end of the market, while the homes most likely to still be underwater are the homes with the lowest home values, those most likely to be affordable to first-time homebuyers.
The housing market has consistently been heading in a positive direction for about 3 years. By the end of second quarter 2014, borrower equity had increased $1 trillion since second quarter 2013. As more homes return to positive equity and those already there add more equity, the market will continue to pick up steam and put the lean years following the financial crisis further behind.
Some of the other positive signs we have seen are continuing reductions of the foreclosure inventory and distressed sales. The national inventory of foreclosed homes fell by 33% year over year in August 2014 to just 1.6% of all homes with a mortgage, down from 2.4% in August 2013. This is the 34th consecutive month of year-over-year declines in the national foreclosure inventory.
In addition, distressed sales were just 11.2% of total home sales in August 2014, which is the lowest percentage of total home sales since December 2007 and quite an improvement from when this category was 15% percent of total sales the same time last summer. Within this category, REO sales accounted for 7.2% and short sales 4% of total home sales in August 2014. At the worst in January 2009, distressed sales comprised 32.4% of all sales, with REO sales accounting for 28% of that. Because REOs typically sell at a larger discount than short sales, this ongoing shift away from REO sales is a driver of improving home prices.
Watch for more updates on the state of the housing market, and leave a comment if there are any particular topics you would like to see us discuss in future posts.


Recent Comments