There is no denying that the United States has increased its crude oil output. In the last 4 years, oil production here has grown from around 5 million barrels to about 8.5 million barrels per day. According to the U.S. Energy Information Administration (EIA), the share of total U.S. petroleum consumption met by net imports fell from 60% in 2005 to an average of just 33% in 2013, and that percentage has been continuing to drop, in large part due to fracking. But many consumers aren’t seeing much benefit at the gas pump.
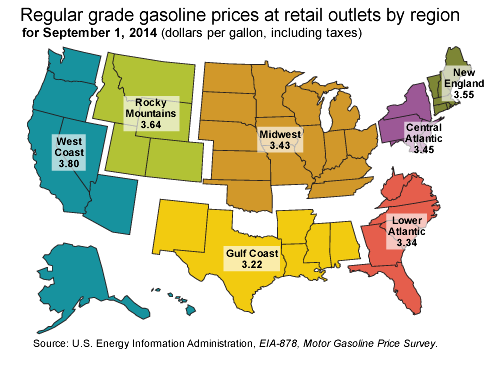
In particular, gas prices differ widely by region. Despite price volatility, if you watch the trends over time, you’ll see that gas prices are cheapest in the Gulf Coast region and highest on the West Coast. Here in Seattle, a gallon of gas costs about $3.90, while our colleagues in our East Coast office outside of Atlanta are filling up their cars at prices hovering around $3.30, give or take a nickel.
According to the EIA, the retail price of gasoline is influenced by four main factors:
- The cost of crude oil
- Refining costs and profits
- Distribution and marketing costs and profits
- State, federal, and local taxes
When it comes to the cost of crude, domestic oil tends to be a bit cheaper than imported oil. These days, the majority of our crude oil is domestic; however, oil independence varies by region, and while imports have plummeted in the Gulf Coast region, the West Coast still imports much of its oil.
Even as far back as 2007, U.S. refineries produced over 90% of the gasoline used here. And about 45% of the gasoline produced in the United States comes from Gulf Coast refineries. Not coincidentally, the Gulf Coast region tends to have the cheapest gas prices in the United States. We also note that problems at a refinery can cause considerable fluctuations in local gas prices.

Perhaps the most important factor is distance from the source and distribution costs. The retail price of gasoline tends to be higher the farther it is sold from the ports, refineries, pipelines, and terminals that provide the supply. In addition to producing and refining much of its own oil and gas, the Gulf Coast region is also the starting point for most major gasoline pipelines, and distribution costs in the area tend to be low. In contrast, average gas prices in Hawaii ($4.28) and Alaska ($4.02) are the most expensive anywhere in the nation. Hawaii must pay exorbitant shipping costs to meet its oil needs, and while Alaska produces most of its own oil, distribution costs within the state are very high. As a parallel, Hawaii does not have its own white sugar refinery; it does, however, process its own raw sugar. So, any sugar cane destined to be white sugar for use in baking and as a sweetener for coffee and tea has to be shipped thousands of miles to a sugar refinery in Crocket, California, get processed, and then be shipped back to Hawaii.
State and local taxes are also certainly a factor, as gasoline motor fuel taxes are, on average, highest on the West Coast. However, there is a lot of variation by state and among different localities. Looking at our two examples, as of July 2014, the total local, state, and federal taxes were only about 10 cents per gallon (cpg) lower in Georgia (45.89 cpg) than in Washington (55.90 cpg) according to the American Petroleum Institute.
Environmental legislation is another factor. Some areas of the country have passed regulations requiring the use of special reformulated gasoline with additives to help reduce carbon monoxide, smog, and other toxic air pollutants. About a third of the gasoline sold in the United States is reformulated, particularly in California and parts of New England and the Central Atlantic. Other environmental regulations restrict fuel transportation and storage. All of these programs add to the cost of producing, storing, and distributing gasoline.
Are gas prices poised to begin dropping? Or will factors beyond supply and demand continue to keep the cost of gas high? Sound off in the comments.
Retail gas price map and gas pump figure courtesy of the U.S. Energy Information Administration.


Recent Comments