
As I have discussed in previous posts, a geographic information system (GIS) enables us to capture, store, integrate, analyze, and display data from a geographic perspective. GIS includes the following elements:
- Software, hardware, and data
- Relative locations of features in x, y, and z coordinates (longitude, latitude, and elevation)
- Relationships between features
You probably don’t need to know much about the hardware and software, but it might be helpful for you to understand a bit about GIS data, so that’s what I’ll discuss in this post.
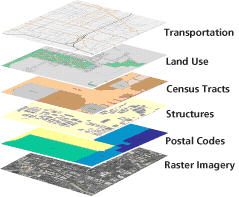
GIS generally stores information in themes or layers that hold data about a particular type of feature. Each layer is linked to a specific location, and they can be overlaid so we can examine how they interrelate. For example, a map produced for one of our projects might include layers for streets, parcels, rivers, and railroad tracks in our study area, along with their attributes.
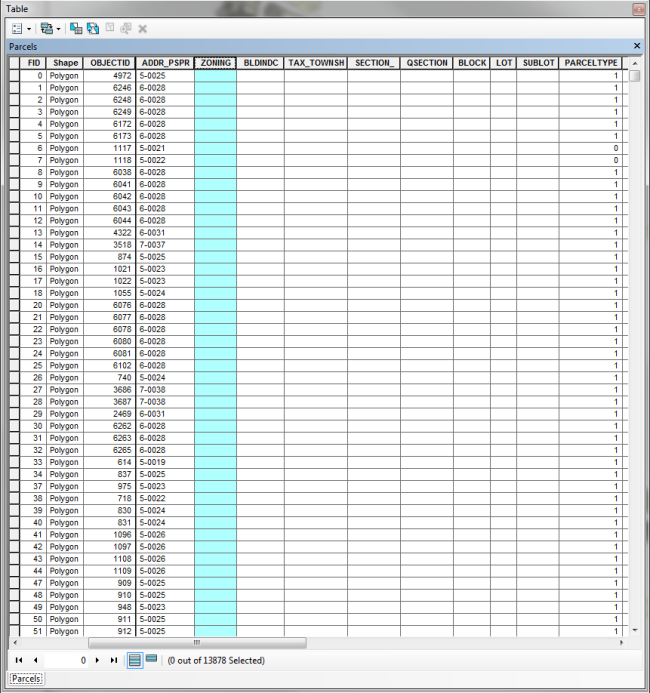
The database is the foundation of the GIS. For each of our projects, all of the GIS data about the project is stored in a database. Information in a database needs to have a unique identifier (such as a parcel ID from the county assessor, or a GAID that we assign) to link all of the information for each property.
Attributes are descriptive data that GIS links to map features. For example, the attributes of a residential property might include assessed value, address, square footage, number of bedrooms, number of bathrooms, presence of a garage, and so on. These attributes are stored as tabular data (in tables) in a database and relate to the feature (residence) using the unique identifier.
The real power of GIS comes from its ability to match and overlay different layers for the same geographic area, allowing us to visualize the interactions among the different data. For example, I might have one file that contains information about residential properties in a neighborhood, one that contains information about real estate transactions (including days on market and sale price), and one that shows chemical concentrations in soil or groundwater after an industrial accident. By overlaying these files, I can see the correlations among all these factors.
GIS enables us to perform several levels of analysis, from locating resources to analyzing relationships among various features of an area to incorporating geospatial information into statistical modeling. Because GIS provides a spatial reference for the data being evaluated, it is a powerful tool for modeling scenarios that have occurred or could occur, and being able to show the output on a nice map or other visualization helps clarify the results.
The figure is courtesy of the National Interagency Fire Center, Fire Program Analysis (FPA) System.
– Gabriel Bolden


Great article.
Can I ask you to write more about this? Maybe give any further example? Thank you!